Challenge Nine
Representing Data Through Infographics
Aim/Overview: This challenge explores different ways data may be represented.
Curriculum: Digital Technologies Knowledge and understanding:
Representation of data
Level 6: Examine how whole numbers are used to represent all data in digital systems (ACTDIK015)
Processes and production skills
Collecting, managing and analysing data
Level 6: Acquire, store and validate different types of data, and use a range of software to interpret and visualise data to create information (ACTDIP016)
Inquiry Question: How can we represent and share data to make it meaningful for specific audiences?
This is a simple yet complex question. When I do my infographics, I could have some pretty graphics, but will the pictures represent anything? I could open a program and start adding items based on the ‘rule of three’. It would be pleasing to the eye, but does it have the right data? I could think of some data I want to visually explain, but poor planning results in confusion.
So, instead, I will explore the processes required to make an infographic. I will develop the idea I want to communicate, drawing out the message or story using images and words. I will then edit and post. So, let's go!
| NOTES | |
|
Gather sets of data that relate to a technology-related issue and find ways to represent it through creating infographics. |
|
| 1. |
What are infographics, and why are they important? Data is available to the public every minute of the day and can be overwhelming. Depending on the type of presentation of the data, it can be difficult to understand. This challenge is developing the knowledge and understanding of infographics to present information using visual and written language in a way that students can understand. |
| 2. |
The value of data visualisation: How do we find the meaning, find the story, share the story—infographics – where data meets design. Simple changes make comprehension almost instant. Colour, size, orientation, flicker. Visual clues that the brain processes quickly. Patterns, colour to show correlation, size to show quantity. Orientation to show trends. Processes, hierarchy, anatomy, chronology. Your message is only as good as how you share it. https://vimeo.com/29684853 |
| 3. |
Chiara Ojeda: creating an infographic requires analytical skills. Have detailed (not complex) visuals that match strong and compelling data. |
|
Draw a mud map that describes how I collected data, interpreted data, summarised important data and put data into an infographic including pictures, words, colours, patterns etc. see number 2. |
|
| 4. |
Resource link of infographics to curriculum: Developing student abilities in visual literacy and information management. Critical concepts for developing 21st Century Skills and literacies. There are three ways to use infographics (as source information, a tool to teach visual and critical literacy, students to express their data).
So, for this one, I may make a list to support the claims in the article or a visual story to make the article more visual and exciting:
|
| 5. |
Infographics can be used by all levels of students, as seen on the website. So this may mean discussing how can use this concept for many different classrooms. |
|
Create two versions of an infographic. |
|
| 6. |
Represent the same set of data in two different data sets. So this means doing the list and the visual article. The challenge suggests two programs, but I think I might choose Abode. |
|
Reflection: reflect on the potential infographics that combine design and digital technology in presenting data to an audience. Find links to the curriculum to reflect upon for the application to the classroom. Remember to look through the design technology topics and add any information from here. |
|
|
Table of Ideas |
||
|
Idea development |
Define the audience. Define and refine the idea (to be read or interpreted within 30 seconds to 4 minutes). |
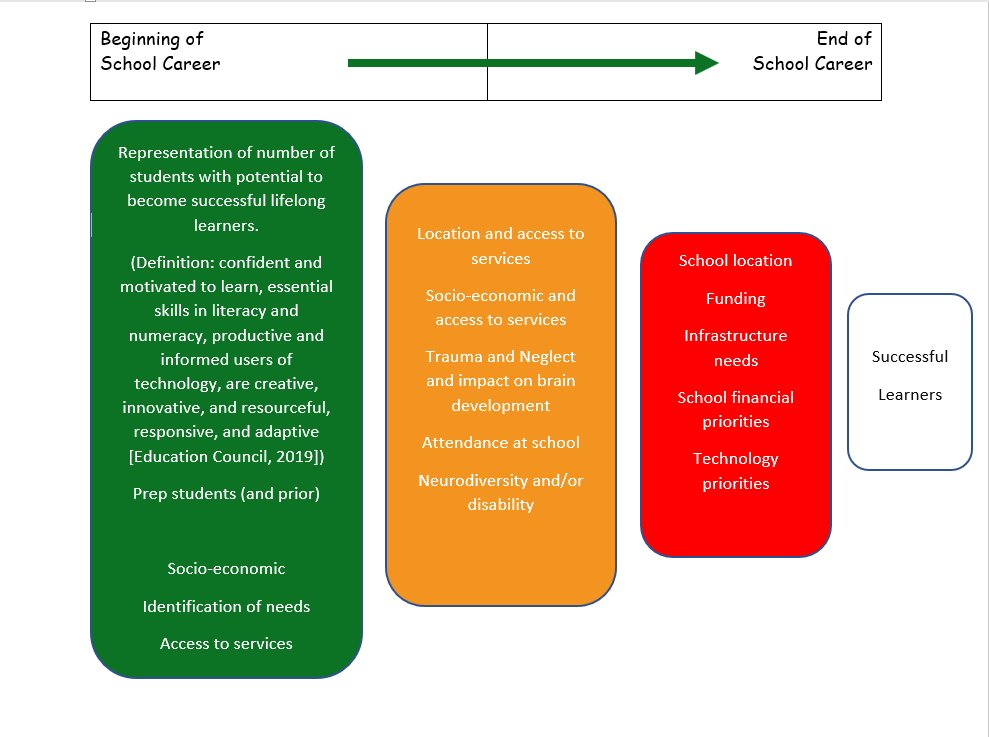
“Is it More Than Just a Digital Divide?” Show it is not just the digital divide that affects learning. Instead, it is an added burden on top of existing difficult learning situations, especially for low socioeconomic schools with diverse students with complex needs. Reflection: I really struggled to pinpoint the items I wanted to portray in the Infographic. There is so much in my head that I think I was inconsistent in the messaging. While I may not have consistently presented the message, at least upon reflection, I am aware of this and can make changes in the future. I have learnt a decent amount through this experience and can use it in my classroom when creating educational infographics. |
|
Scripting |
Have clear goals and messaging. Chose type of infographic |
Informational: clearly communicating a new or specialised concept or give an overview. Generally divided into sections to help design flow. Visual story, Flowchart or Timeline: visualising the history of something or overview of events. Visual aids like lines, icons, photos, and labels explain points of time. Best infographics for teachers – consider types of learners – visual, kinaesthetic, auditory, stress, ease, scribble, trust, teach, copy. To make boring and technical information fun and hang in the classroom. Reflection: This was the original script; however, it did change during the infographics creation. As I stated above, I found it difficult to translate my idea into infographics. |
|
Storyboarding |
Ideas and pictures to make the story come alive. |
Picture of student/s looking up at the cloud of successful learning outcomes. With two layers of barriers in between. The first is educational barriers of socioeconomic and other complex needs. The second is the digital divide created due to socioeconomic barriers and other complex needs but adds another barrier to successful learning outcomes. Reflection: see storyboard below. I didn’t fill out the storyboard with my ideas. Instead, I filled it out with tips and tricks from the Venngage website. I then looked at the storyboard to help with ideas when creating the infographics—a little like a checklist. |
|
Editing |
Record story and edit. Draw on whiteboard, paper or screen capture. When complete, you still need to edit, insert title, narration, credits and contact details. |
Reflection: I really struggled with the first Infographic titled Digital Divide. I didn’t know how to represent all the ideas I had in my head in a reduced coherent manner. I then realised I was struggling because I had too much information, so I reduced the data. I realised I was trying to add comparing statistics to prove the differences between the haves and the have nots. I reduced this data just to reflect the number of disadvantaged students. |
|
Posting online |
Put into a format that can be shared. Embed into a website for more access. | |
The following two diagrams are a reduction of my ideas and the step before I opened up Adobe Sparks Post to create an infographic:
| Storyboard | ||
| Layout |  |
Digital Divide
All Learners
|
|
Background |
|
|
|
Icons/pictures |
Inform Change Compare Organise Reveal relationships Explore Icons/symbols have meaning – and can be checked here https://venngage.com/blog/how-to-make-an-infographic-in-5-steps/#4 |
Example – to help see https://venngage.com/blog/how-to-make-an-infographic-in-5-steps/#3 Digital Divide
All Learners
|
|
Data/Information |
Readable font Big header, section headers, data highlights to ensure gist of Infographic is apparent |
|
|
Other |
Repetition, consistency, alignment Use of grids (boxes) for data and flow. Repeat these grids for consistency. Icons to reinforce information and consistency – colour, style, size. Also, consider background icons (size, consistency, meaning, colour etc.). Think of colour to communicate meaning (green/red or linking data through same colour grids/boxes etc. |
|
Figure 1 data collected into storyboard table from Venngage (Nediger, 2020)
The Final Infographics
This one is my favourite. I feel like it visually tells the story of so many students educational journey. So many hopeful eager students at the beginning of their educational journey. Then with each barrier they hit, we lose some of our learners until eventually there are only a few students at the end who become successful lifelong learners.
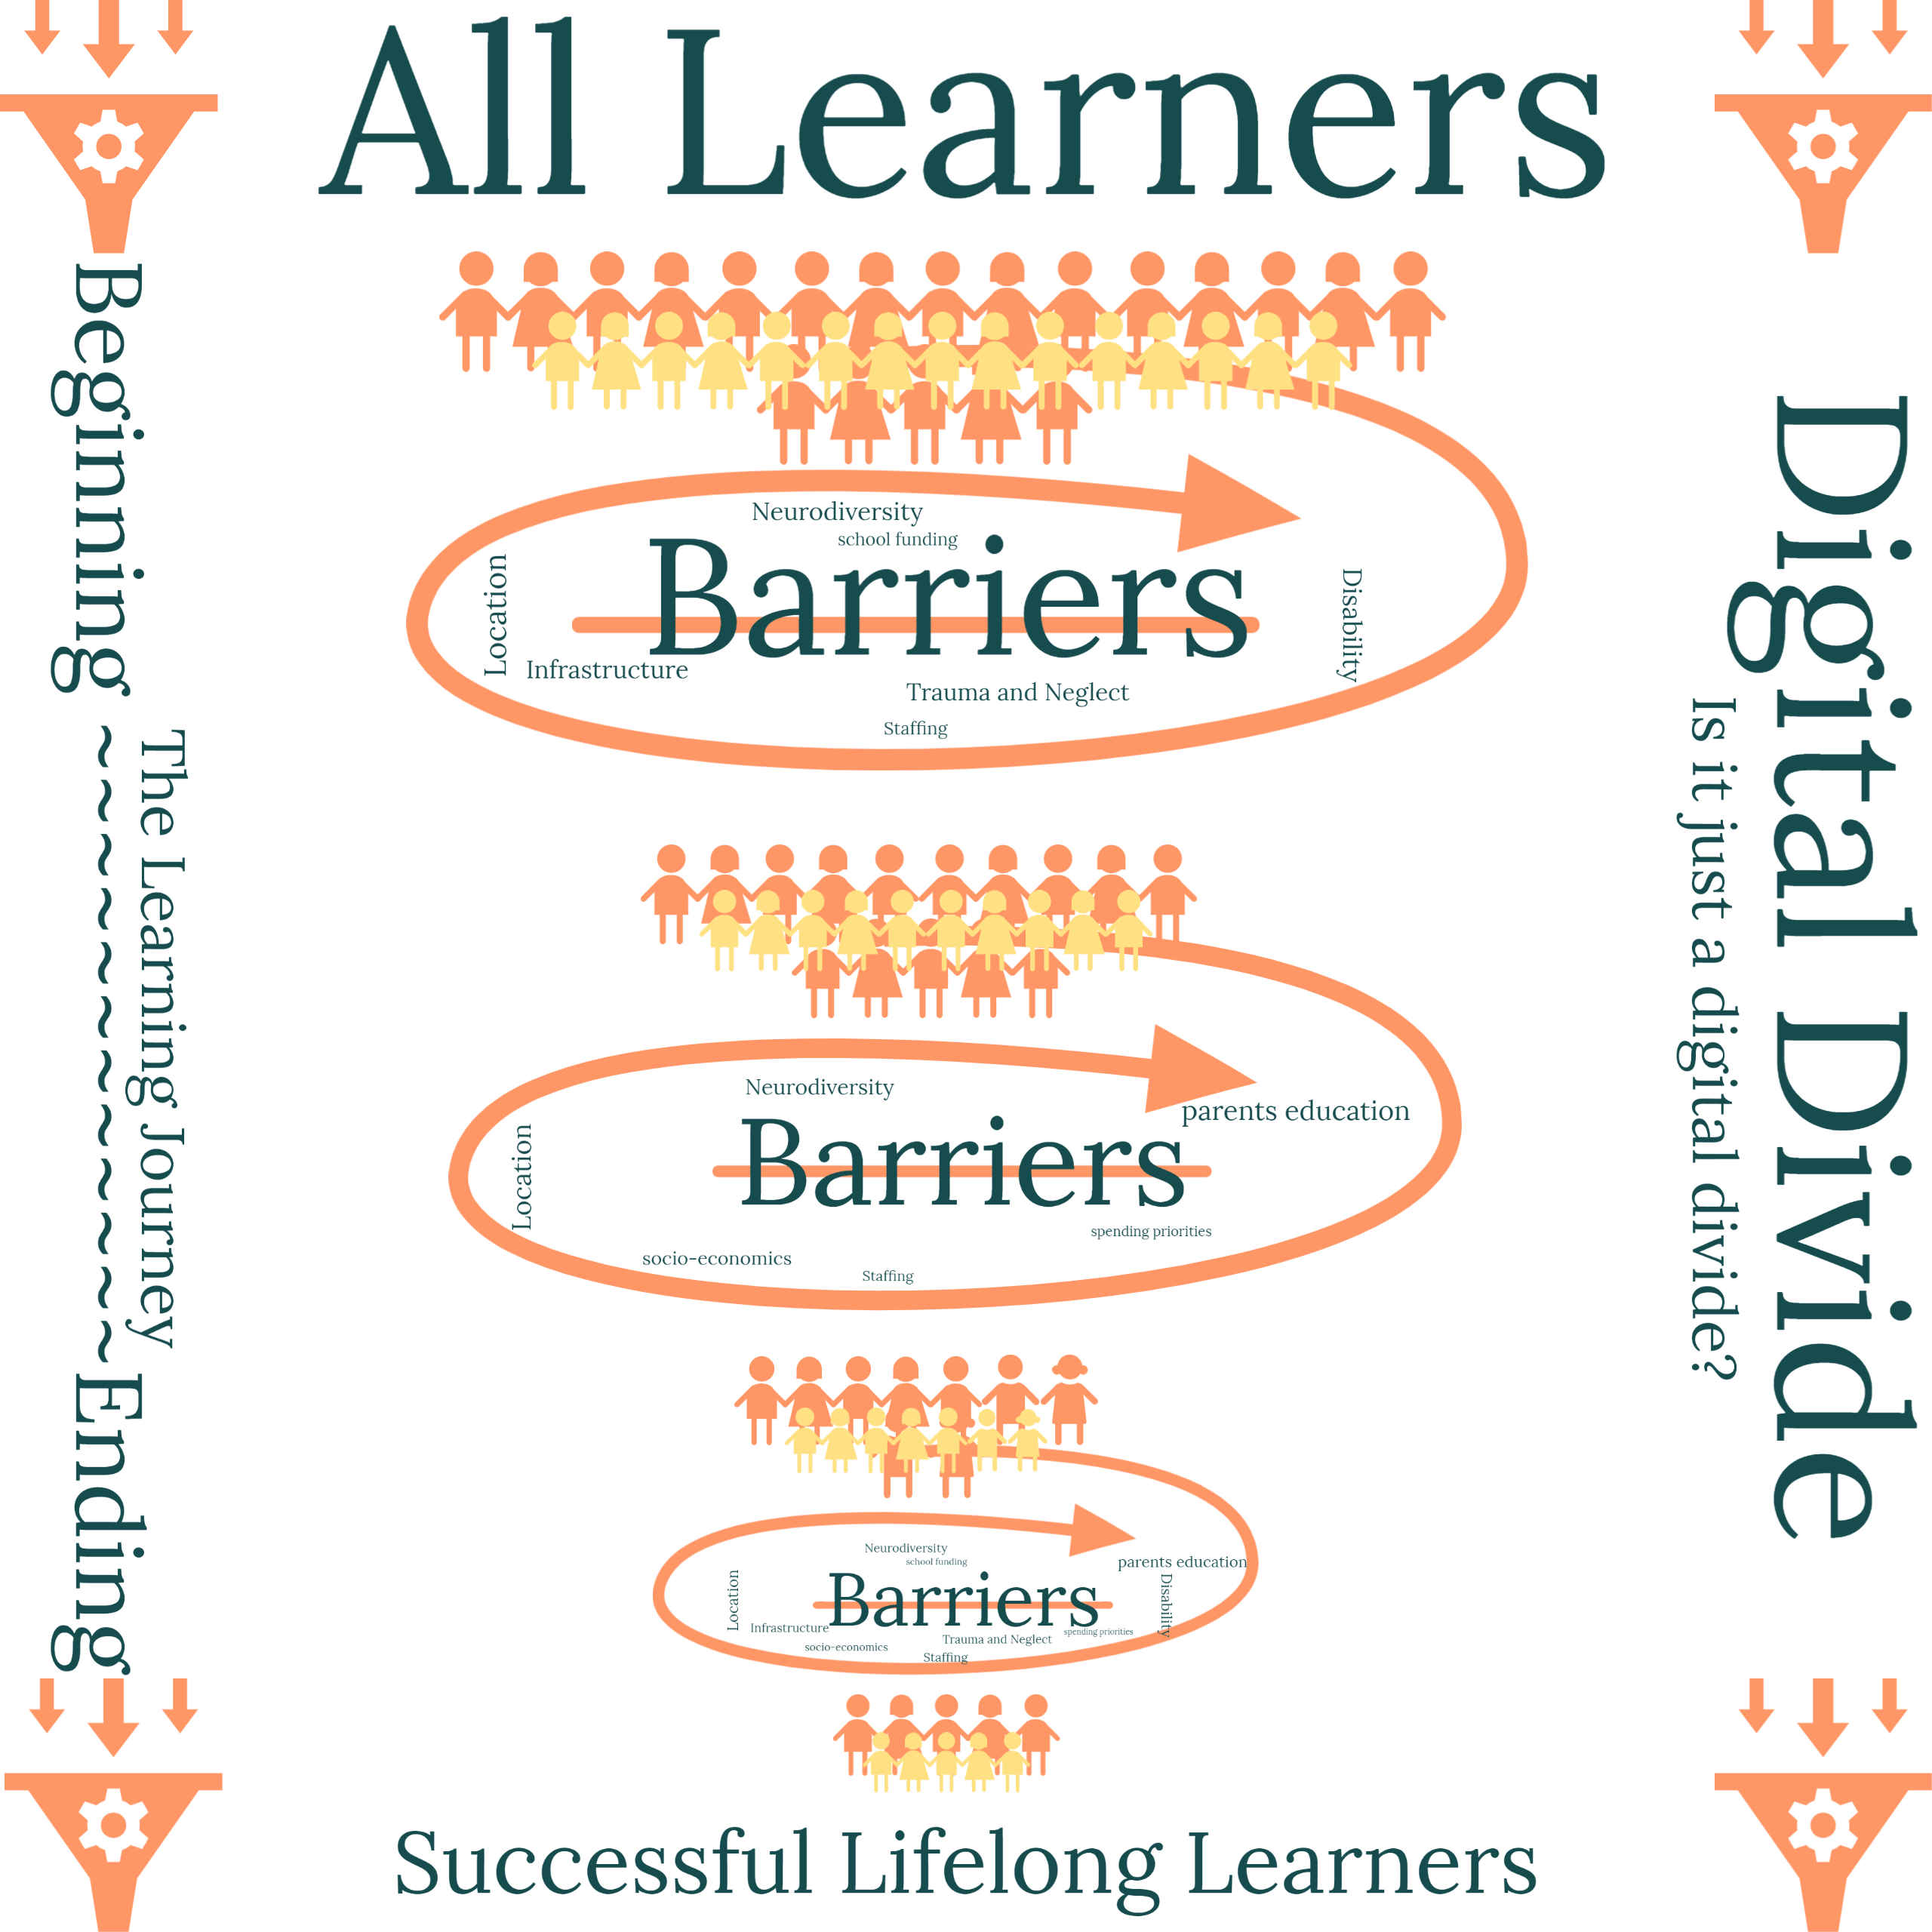
https://spark.adobe.com/post/WUJrH0hlZ6Rxv/
This is my first attempt at Infographics. It is statistical in nature, and I feel a bit bland.
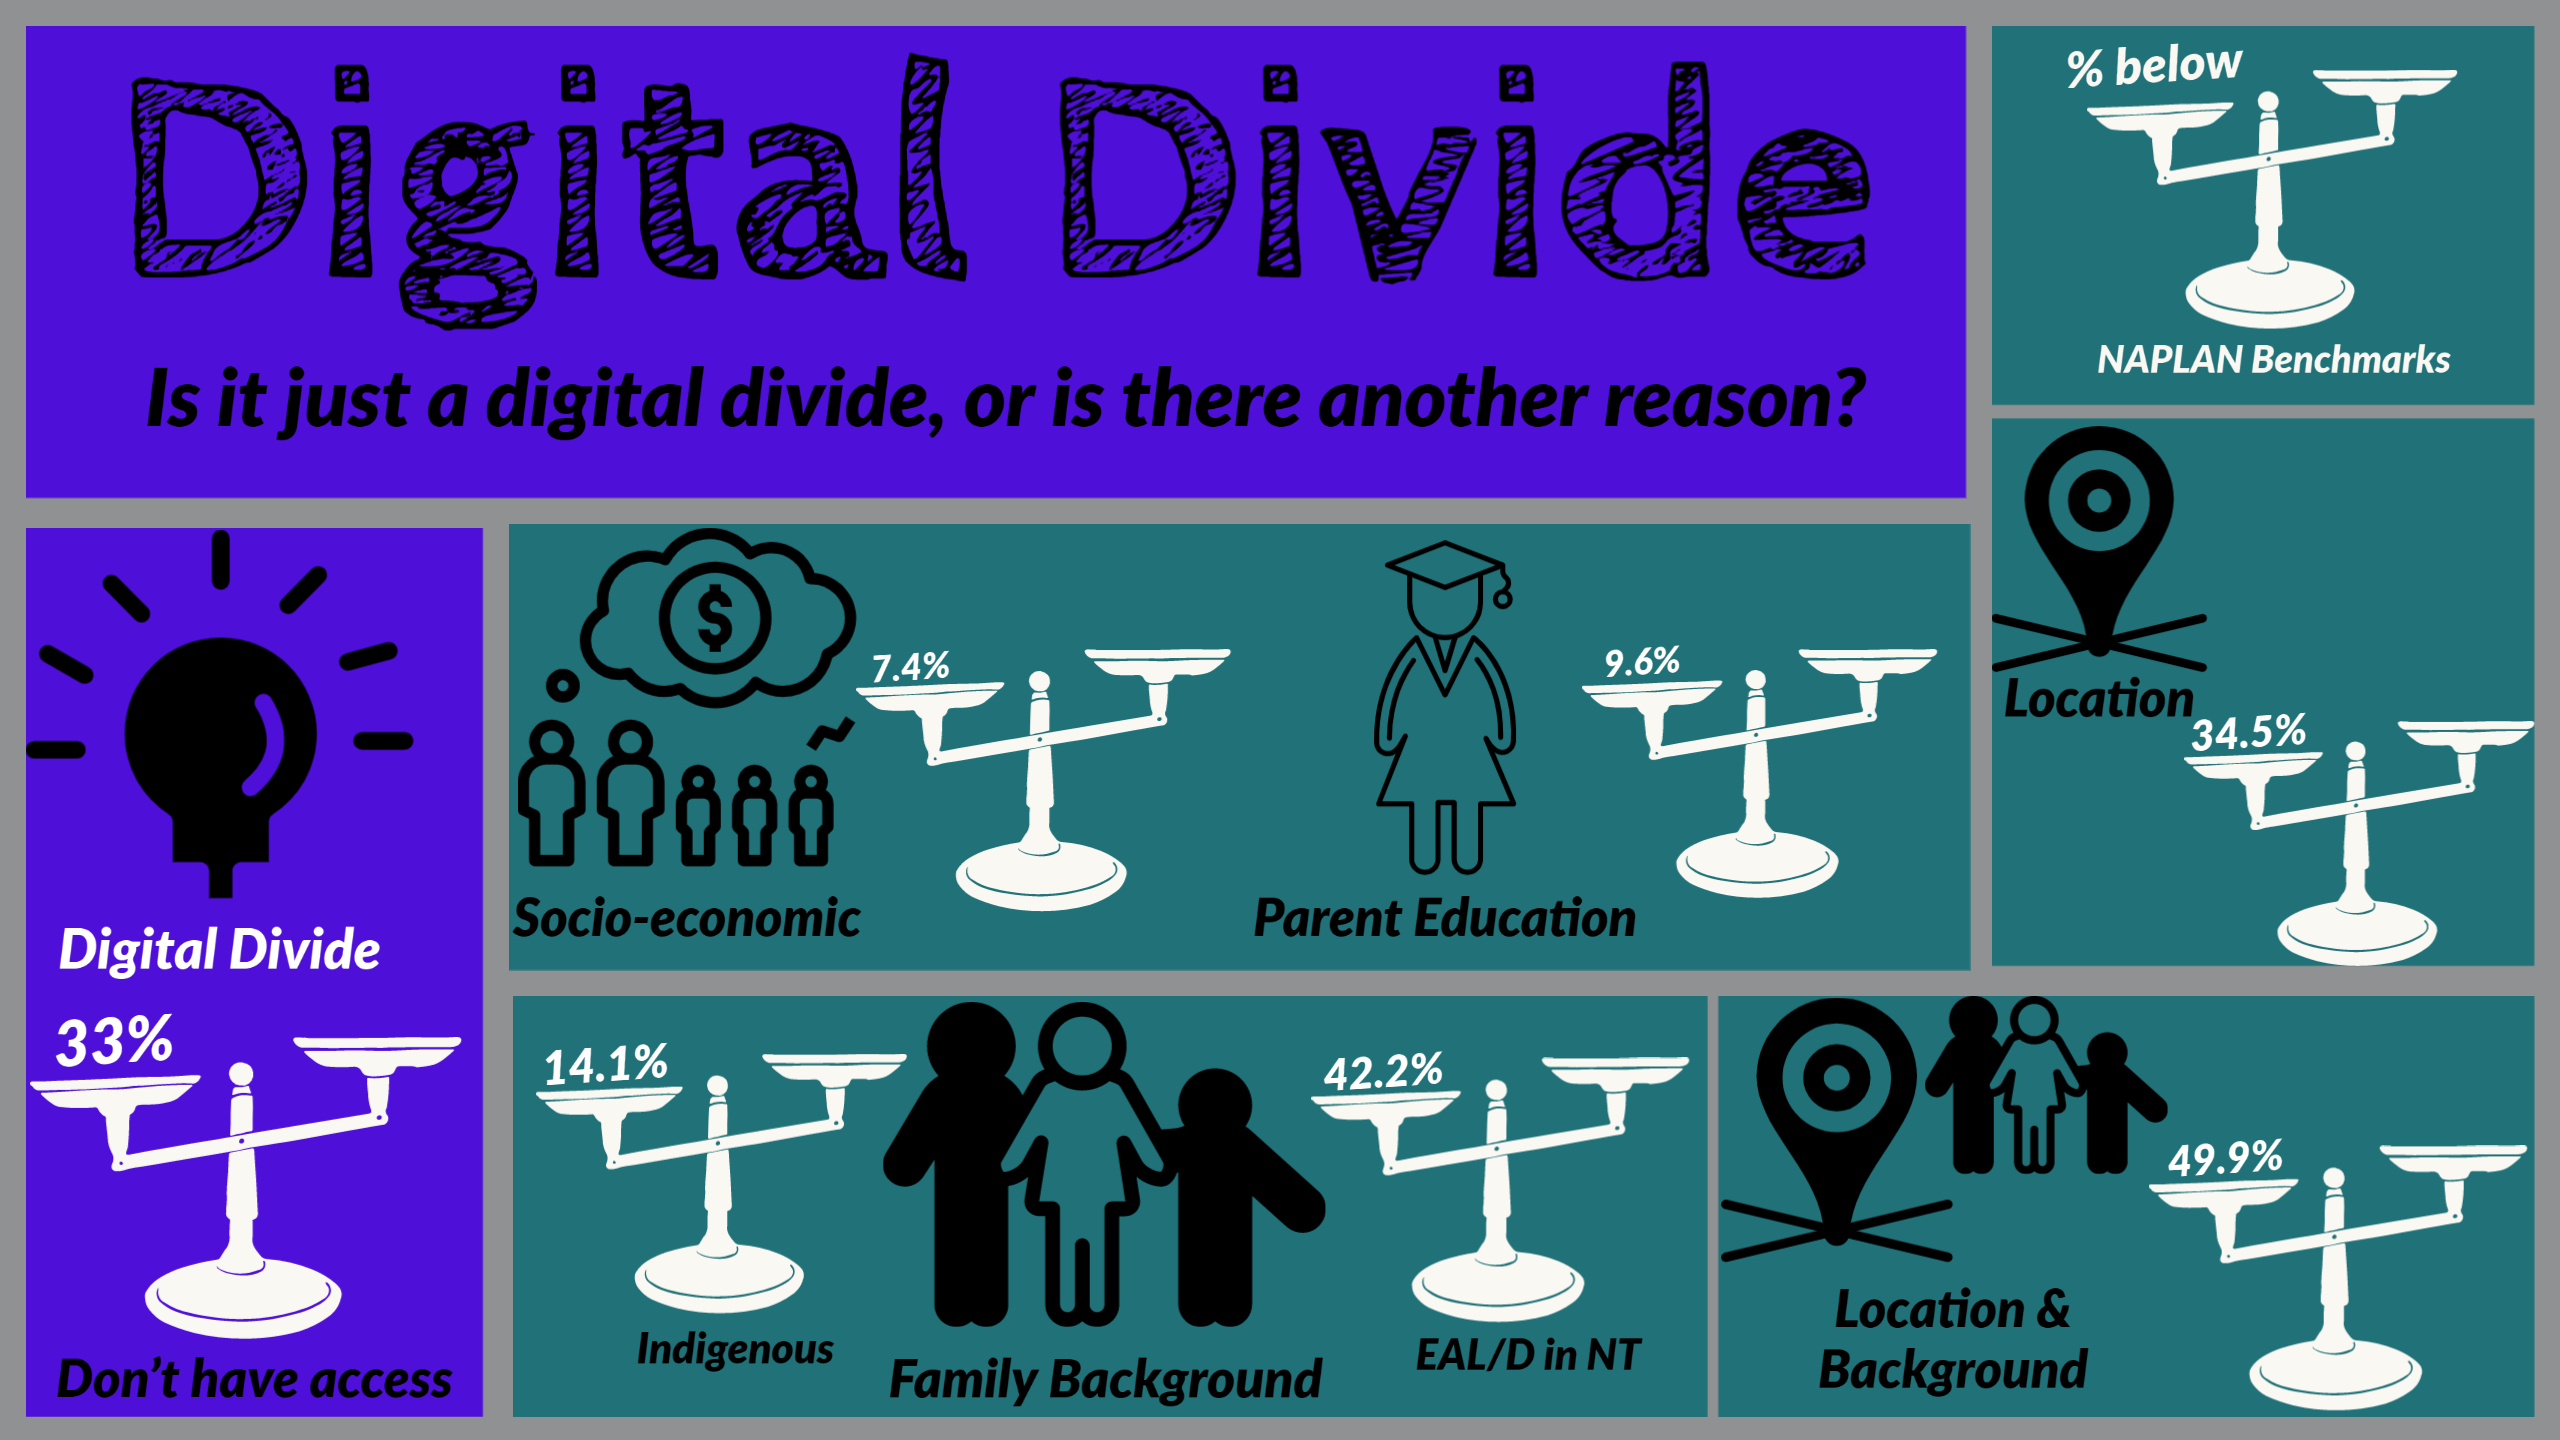
https://spark.adobe.com/post/Pka06ejNkq5cM/